Device Analytics Step by Step Configuration
Device Analytics Step by step configuration
Device Analytics | Provisioning Azure Resources
Creating Application Insights and Log Workspace for ThinScale Device Analytics
This guide will assist you in creating the required resources in Microsoft’s Azure Cloud Platform to take advantage of Device Analytics in the ThinKiosk & Secure Remote Work platform.
This can be accomplished using Azure Web Portal or via Azure CLI scripts.
Either method, the recommended process is to create a “Resource Group” that only contains the “Log Analytics Workspace” and “Application Insights” resources.
This provides the separation of resources where the associated “Application Identity” (used in the Management Console) has read-only permissions only to this specific workspace via the built-in Role Based Access Control (RBAC) group “Log Analytics Reader”.
In This Document
- Process Overview
-
Interactive Web Portal Procedure
- Screenshots
- Command Line Scripted Procedure
- Microsoft Reference Links
Process Overview
- Within Azure Portal with Administrative Access
- Create a “Resource Group” (ex: “ThinScaleAnalytics”)
- Within this “Resource Group” create two services:
- Log Analytics Workspace
- Application Insights (backed by the above Log Analytics workspace).
- Within your Azure Active Directory with Administrative Access
- Create Application Identity (ex: “ThinScale Device Analytics Reader")
- Grant this Application ID with the built-in role “Log Analytics Reader” to the “Resource Group”
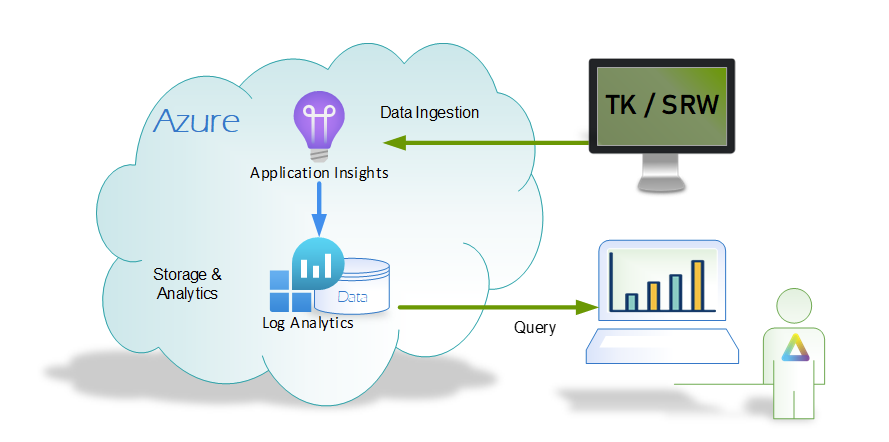
Implementation Overview
Interactive Web Portal Procedure
See “Interactive Web Portal Procedure | Screenshots” for Azure Portal screenshots for each step
- Authenticate to Azure Portal with Administrative Access
- Create a “Resource Group”, and give it a name in our case “ThinScaleAnalytics”
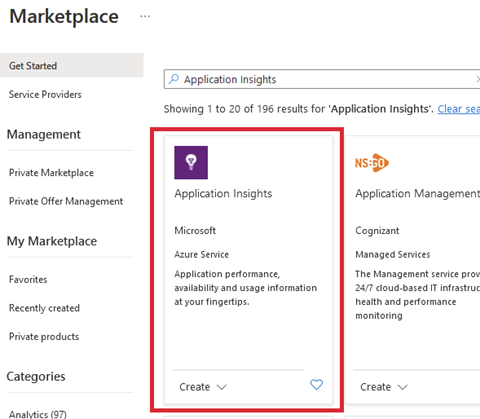
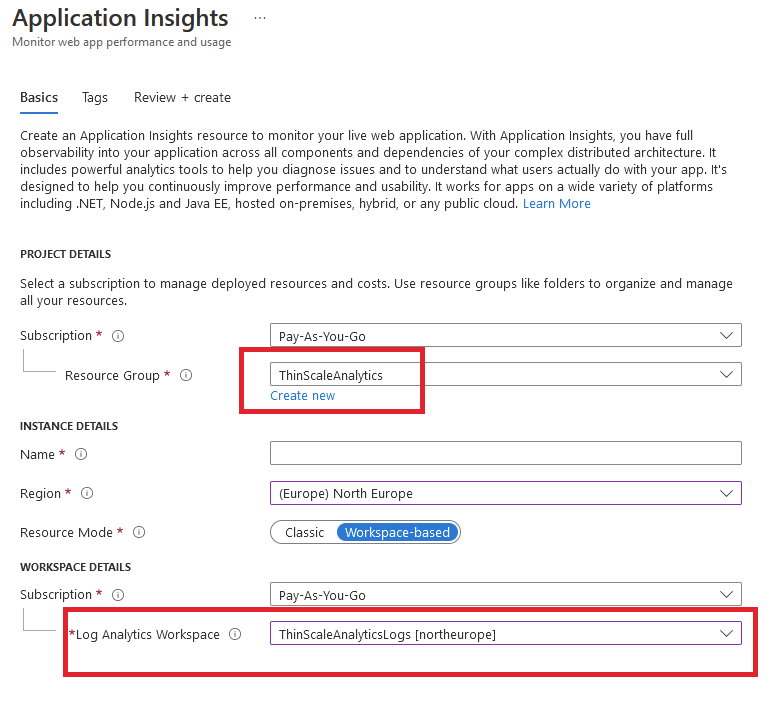
- Within the newly created “Resource Group” click create and from the marketplace add 2 services:
- Log Analytics Workspace
- Application Insights (backed by the above Log Analytics workspace).
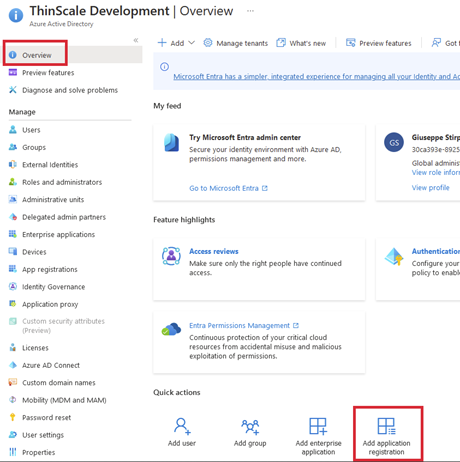
Move over to your Azure Active Directory and Select “Add application registration”
- Create Application Identity (Management Console Access)
- Create an Application ID (Service Principal using RBAC)
- Grant the Application ID “Log Analytics Reader” Role to the “Resource Group”
For the Redirect URI as we do inside our Azure Auth Provider we use the https://login.microsoftonline.com/common/oauth2/nativeclient from Microsoft
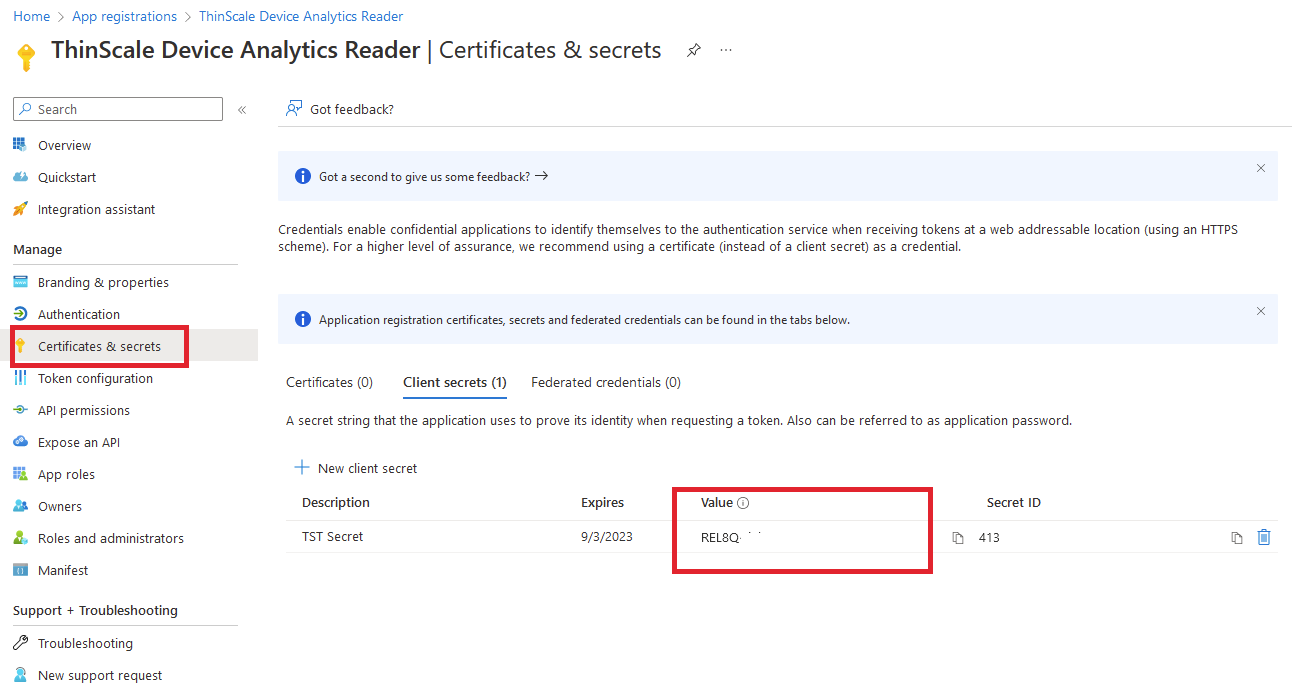
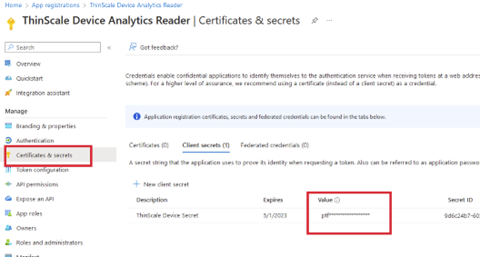
Once done click on “Certificate & Secrets”, create one and copy the Secret Value somewhere. You can only see it once during creation and you will need that value inside the ThinScale Management Console as outlined later in the doc.
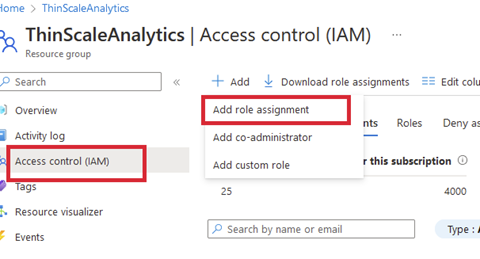
Last, go into your Resource Group now. Select Access control (IAM). Select Add > Add role assignment to open the Add role assignment page.
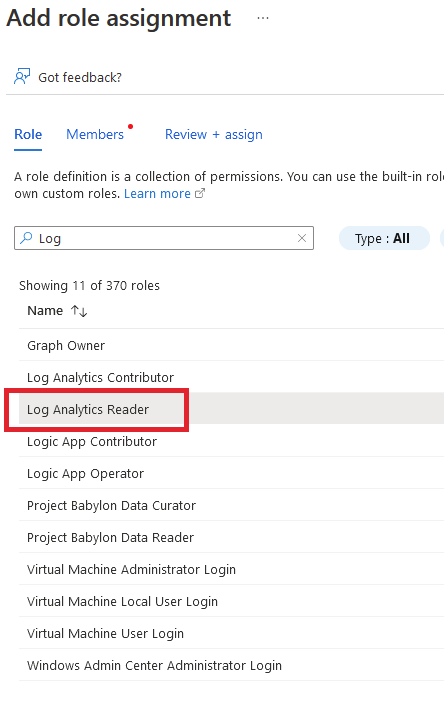
In the Role tab, select the role Log Analytics Reader
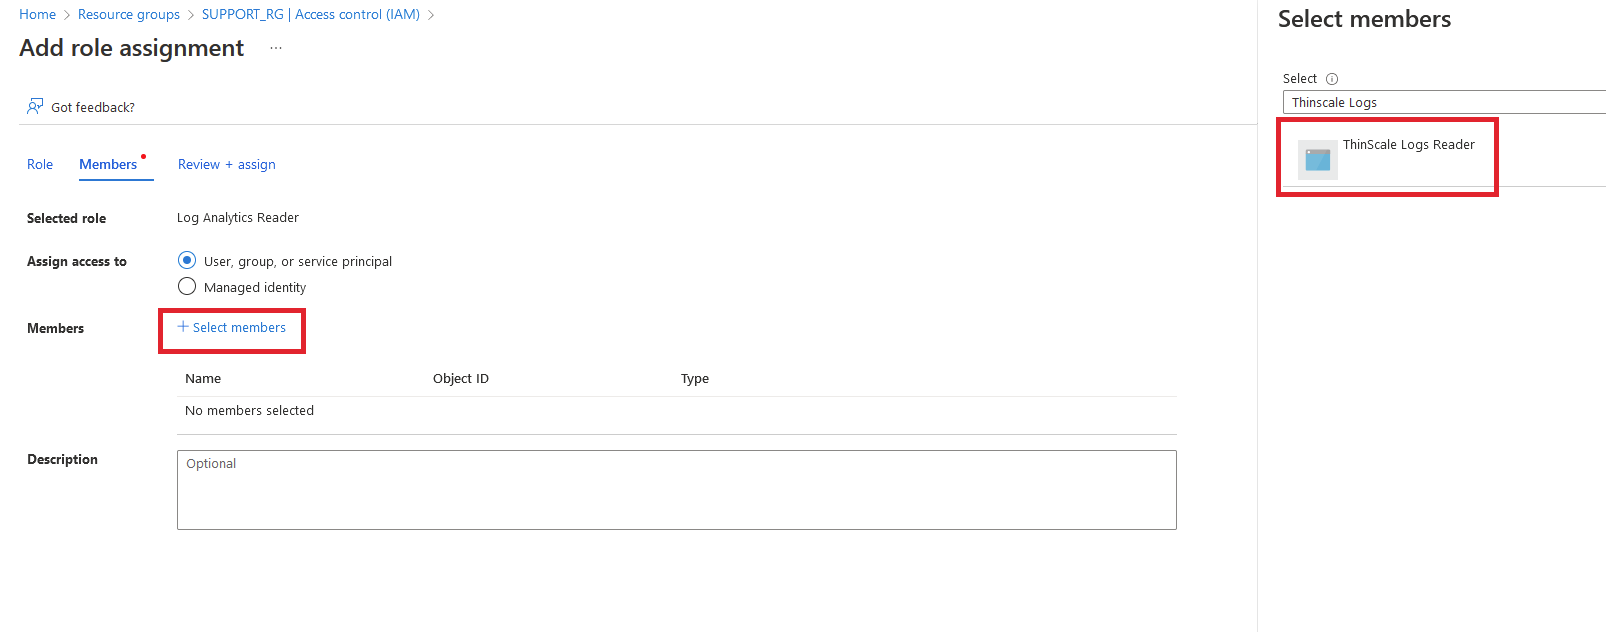
Select the Next button to move to the Members tab. Select Assign access to-> User, group, or service principal and then Select members. By default, Azure AD applications aren't displayed in the available options. To find your application, search by name (for example, "ThinScale Device") and select it from the returned list. Click the Select button. Then click the Review + assign button.
"Your Device Analytics is set up"
Interactive Web Portal Procedure | Screenshots
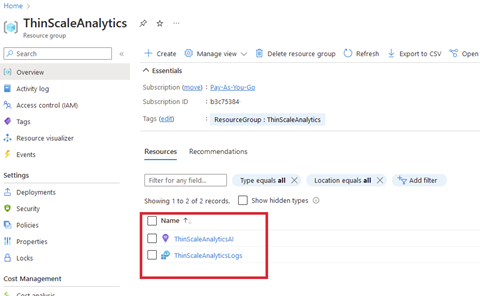
Resource Group


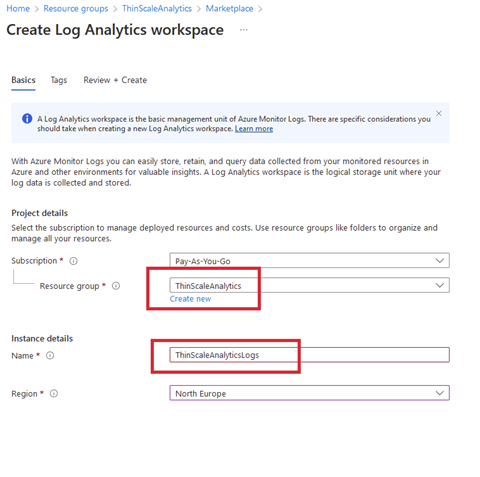
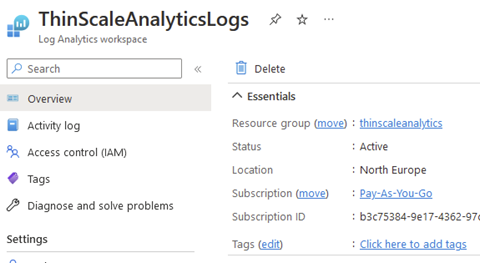
Log Analytics Workspace

Application Insights
Resource Group View
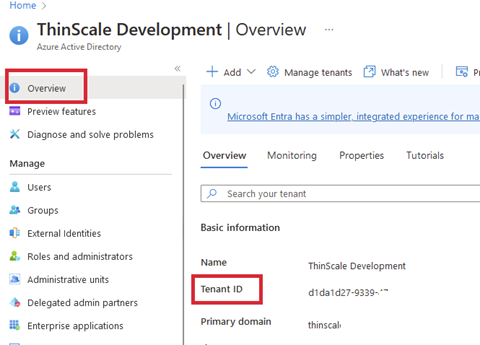
Azure Active Directory Overview Dashboard
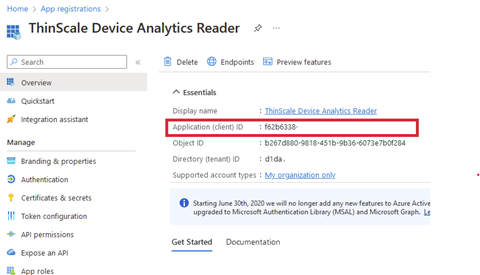
Application Registration (ThinScale Device Analytics Reader)
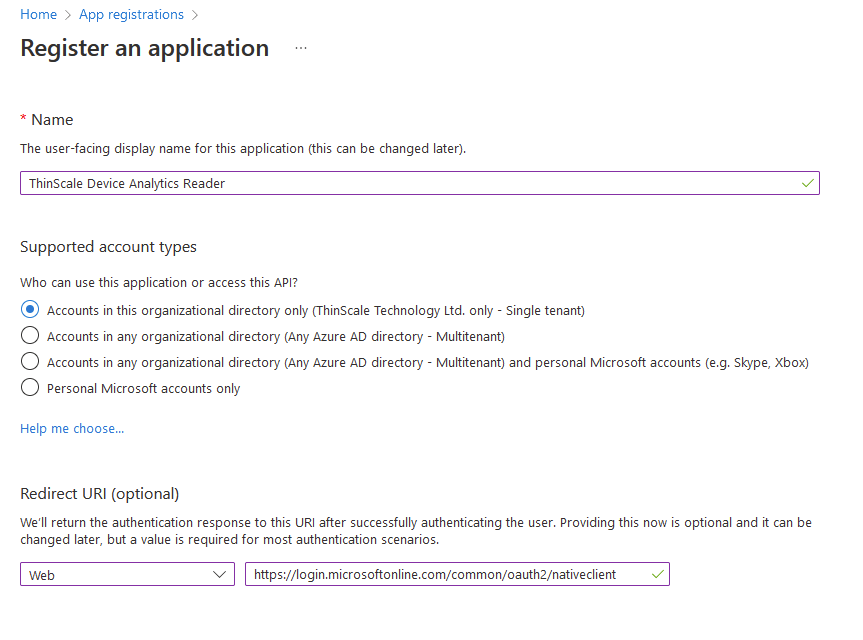
Web https://login.microsoftonline.com/common/oauth2/nativeclient
Copy the Secret Value, you will need this inside the ThinScale Management Console
Go back to your Resource Group and click on Access Control (IAM). Select Add role assignment and add the Log Analytics Reader to the Application ID
Management Console Global Settings View
During the creation of these resources, you will generate several identification and connection details. These will be supplied in the Management Console under “Global Settings” (Figure 1).
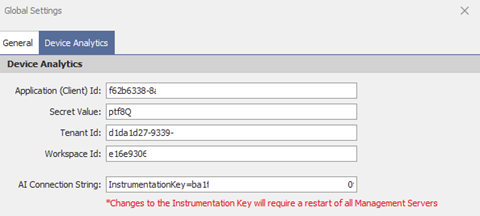
Figure 1: ThinScale Management Console Global Settings
Client ID = Is the Client ID from the App Registrations
Secret Value = Is the Secret Value from the App Registration “Certificates & Secrets” Tab
Tenant ID = You can retrieve the Tenant ID from the Azure Active Directory Dashboard
Workspace ID = Is the Log Analytics Workspace ID

AI Connection String = Is the Application Insights “Connection String”

Command Line Scripted Procedure
The following script snippets will provision the suggested Azure resource configuration. It is segmented into individual steps to follow and confirm each configuration step. Setting the initial script variables as suggested, will allow you to simply copy/paste each segment for this procedure.
This process assumes you have the Azure CLI installed on your local workstation and a PowerShell console window.
Variables
The following variables and suggested values are needed when creating the resources in the portal or via scripting snippets.
Azure Tenant and Subscription Information
$AzureTenant = "aaaaaaaa=0000-bbbb-1111-cccccccccccc"
$AzureSubscription = "aaaaaaaa=0000-bbbb-1111-cccccccccccc"
Resources Setup
$AzureRegion = "eastus2"
$ResourceGroupName = "ThinScaleAnalytics"
$ReaderRoleName = "ThinScale Device Analytics Reader"
$LogAnalyticsWorkspaceName = "ThinScaleAnalyticsLogs"
$ApplicationInsightsName = "ThinScaleAnalyticsAI"
Authentication
Login into the Azure portal and select the target subscription.
Assumes authenticated id has permissions to create resources & an application ID in your AD Directory
az login --tenant $AzureTenant
az account set --subscription $AzureSubscription
Process Details
Create Resource Group
az group create --location $AzureRegion --name $ResourceGroupName
Creating Log Analytics Workspace
$ws = az monitor log-analytics workspace create `
--resource-group $ResourceGroupName `
--workspace $LogAnalyticsWorkspaceName `
--location $AzureRegion `
--sku pergb2018 `
--retention-time 30 `
--ingestion-access 'Enabled' `
| ConvertFrom-Json
Create Application Insights
Azure CLI extension for "Applications Insights" is currently in "preview".
az extension add -n application-insights # az cli in preview asof 22-jun
Create App Insights and hold results
$ai = az monitor app-insights component create `
--app $ApplicationInsightsName `
--location $AzureRegion `
--resource-group $ResourceGroupName `
--ingestion-access "Enabled" `
--workspace $LogAnalyticsWorkspaceName `
| ConvertFrom-Json
Create Application Identity & Assign Permissions
- Create a New Application Identity, Assign Log Reader Access to $ReaderRoleName
- Note: Uses Built-In Role for "Log Analytics Reader"
Creating Application Identity
$appid = az ad sp create-for-rbac `
-n $ReaderRoleName `
| ConvertFrom-Json
Get Service Principal ID
$spid = az ad sp list `
--display-name $ReaderRoleName `
| ConvertFrom-Json
Assigning Permissions to new Role
az role assignment create `
--assignee $spid.id `
--role "Log Analytics Reader" `
--resource-group $ResourceGroupName
Get Access Keys
Using results from above
- Workspace ID
$appid | Add-Member -Type NoteProperty -Name 'resourceId' -Value $ws.CustomerId
- The Following is your Instrumentation Key to use in the Endpoint Configuration
$ai.instrumentationKey
Expected Results
- A “Connection String” used by the Endpoints to send data into “Application Insights”
Client Id": "abcdef1234567-890a-bcde-f1234567890a"
Secret Value": "9240.451-jpjv092049wsdj24-=g0i0"
tenant": "abcdef1234567-890a-bcde-f1234567890a"
Workspace Id”: “abcdef1234567-890a-bcde-f1234567890a”
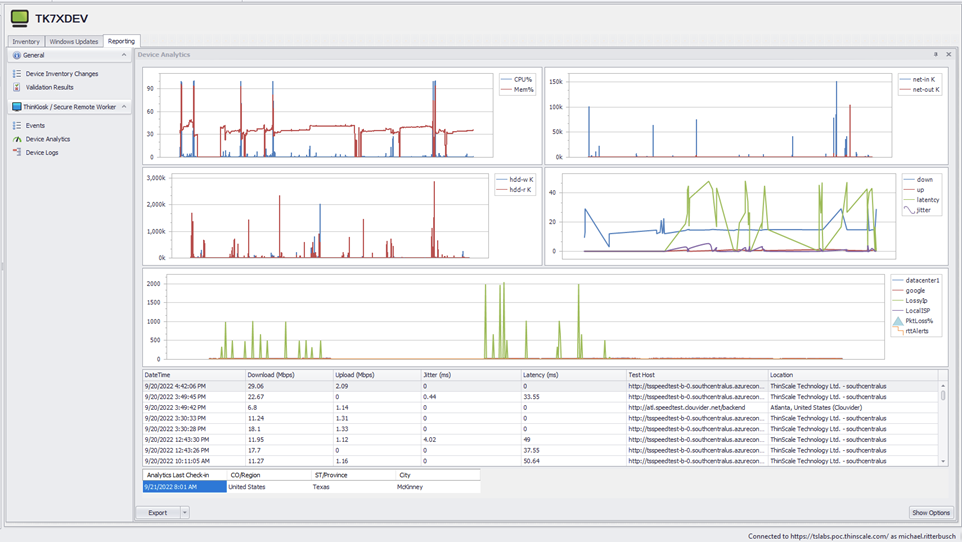
Device Analytics View
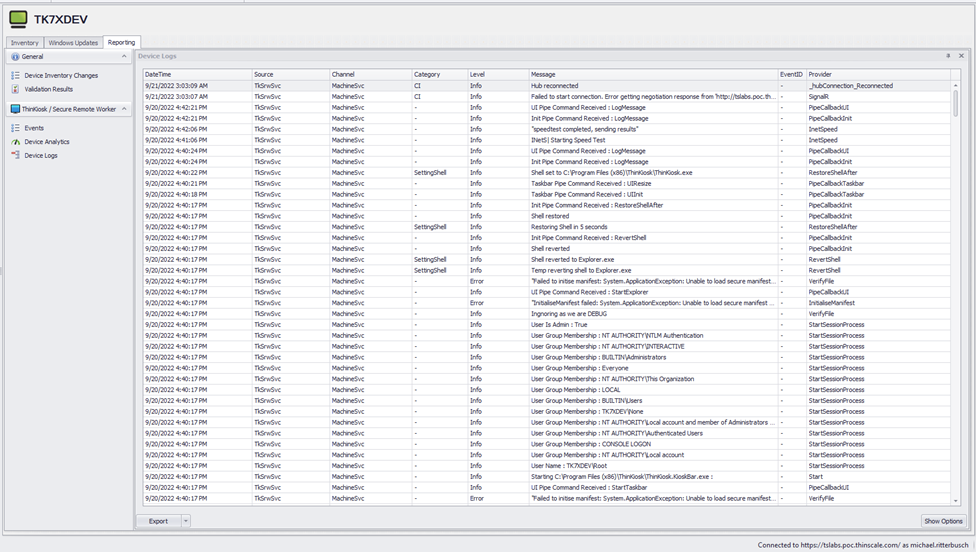
Device Analytics Logs
The new Device Logs Tabs together with the Device Analytics is a powerful tool to analyze the state of a machine directly from the console.
You will be able to see in almost real-time a consolidated view of multiple logs & event sources. This include:
- “Startup Events” (including installed applications if enabled),
- “Windows Event Logs”,
- “TK/SRW “Machine Service” log events, and
- the “Device Analytics” events.
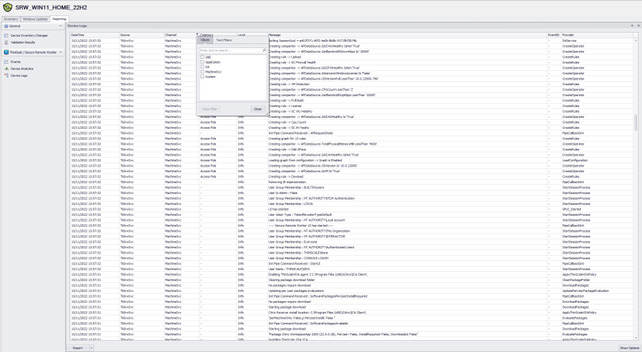
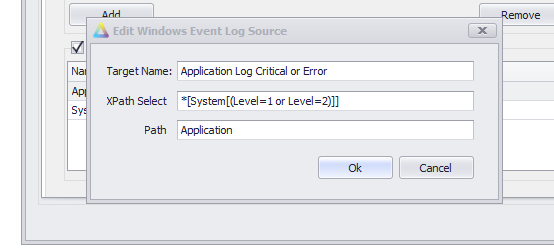
By default, only Critical and Error Logs are saved in the Log Analytics Workspace.

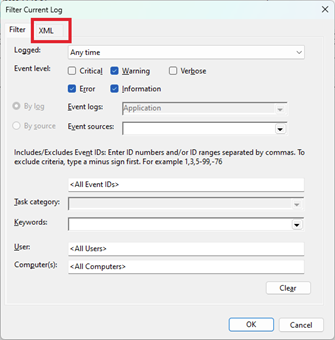
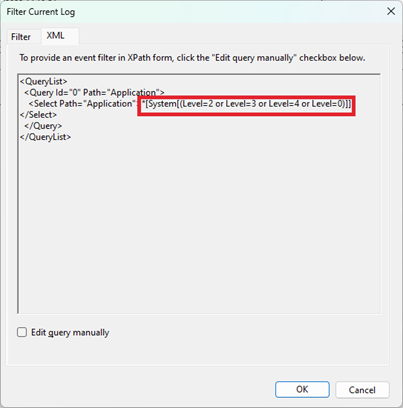
These can be modified using Windows standard XPath Select statements. The easiest way of doing so is via the “Computer Management” option.

Click Filter Current Logs. Select the level desired and then simply copy the XML Value within the Management Console, like so.
Example of Device Analytics
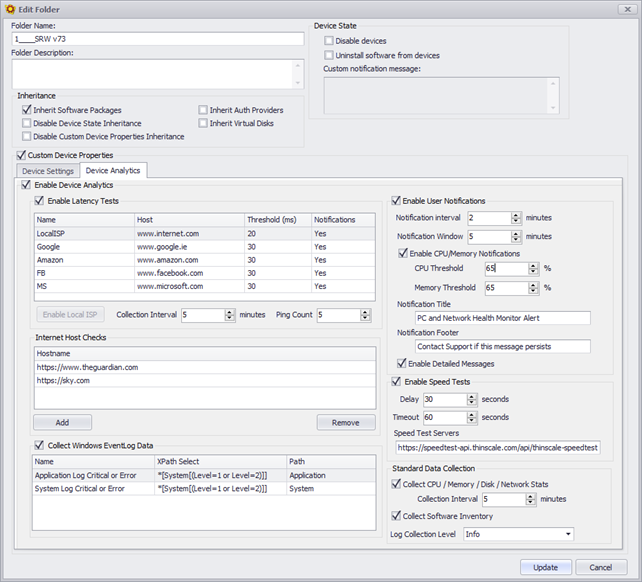
Enabled Latency Test
This is the place where you want your users to perform a speed test against specific URLs or IP Addresses.
Internet Host Checks
This option is to evaluate if the machine has or does not have an internet connection for local diagnostic purposes. A TCP port test of the URI will be logged in the local MachineService, log file
Collect Windows EventLog Data
This option will set the Log Level of the Windows Event Viewer you want the clients to collect.
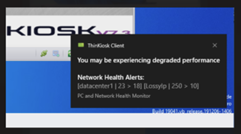
Enable User Notification
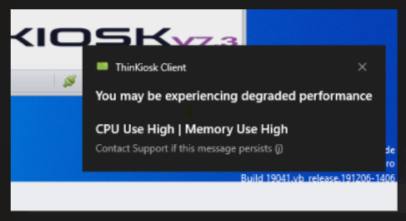
This option is used to set a specific collection interval and a threshold to show users a systray notification.
When that threshold has been reached an example notification will be displayed.
Speed Test Server
Please do not modify modified this value unless instructed by ThinScale Support.
https://speedtest-api.thinscale.com/api/thinscale-speedtest-servers
Standard Data Collection
This is the interval in which the data will be collected.
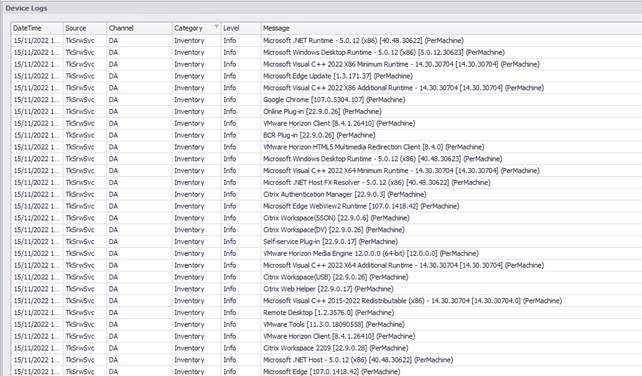
Collection Software Inventory
When enabled Device Analytics will collect all the Installed Applications on the machine.
Please note: AppData (user-based) applications are not collected with this version.
Microsoft Reference Links
Create Log Analytics Workspace
Create an Azure AD app and service principal in the portal - Microsoft Entra | Microsoft Learn
Enterprise Application Identity
Get shared keys for the workspace